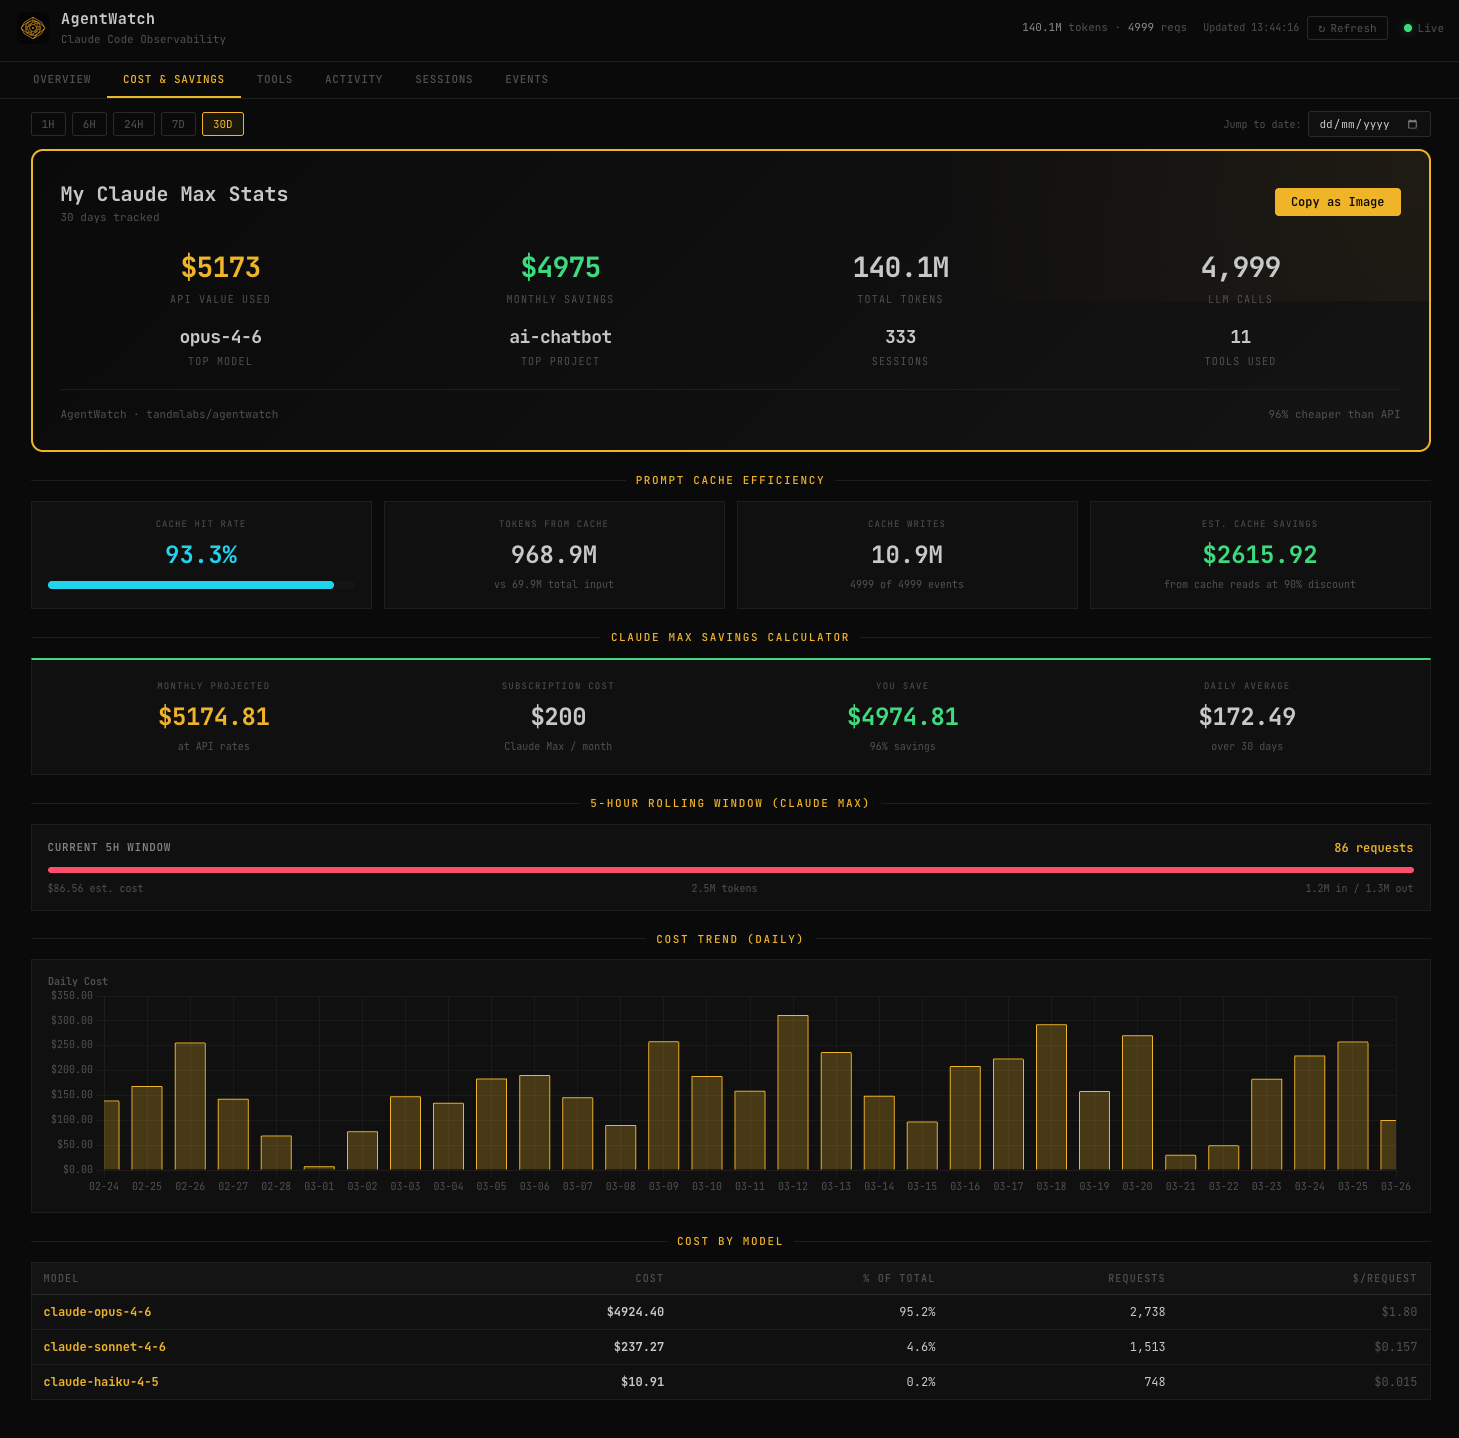
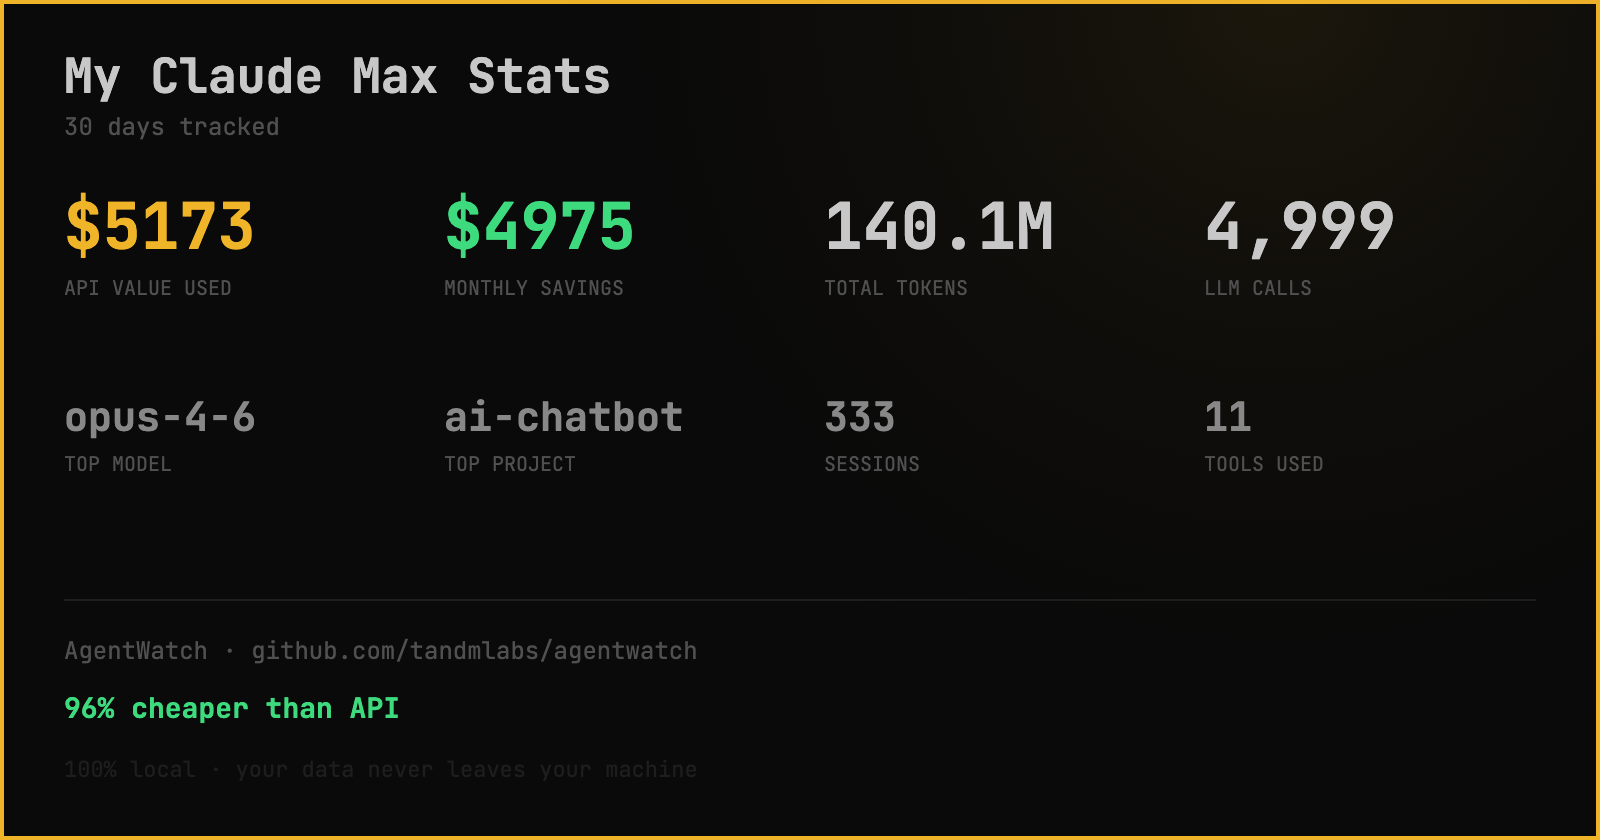
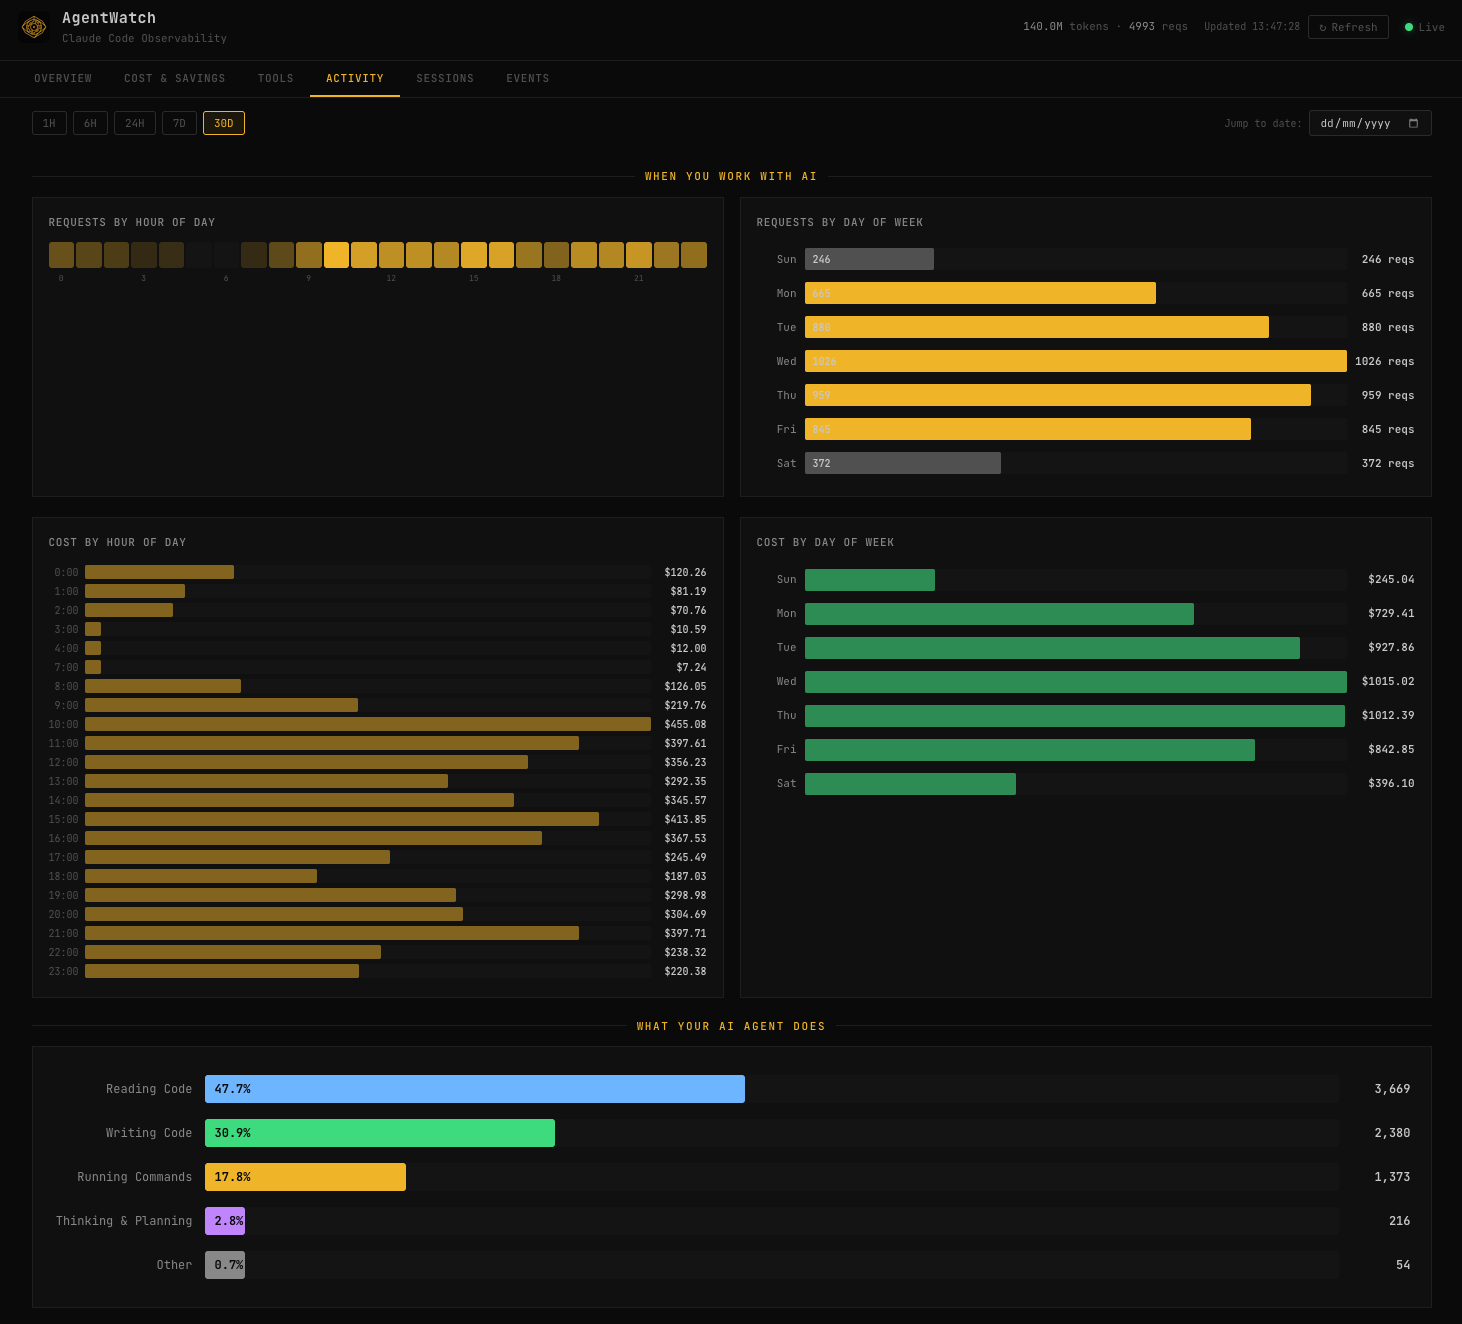
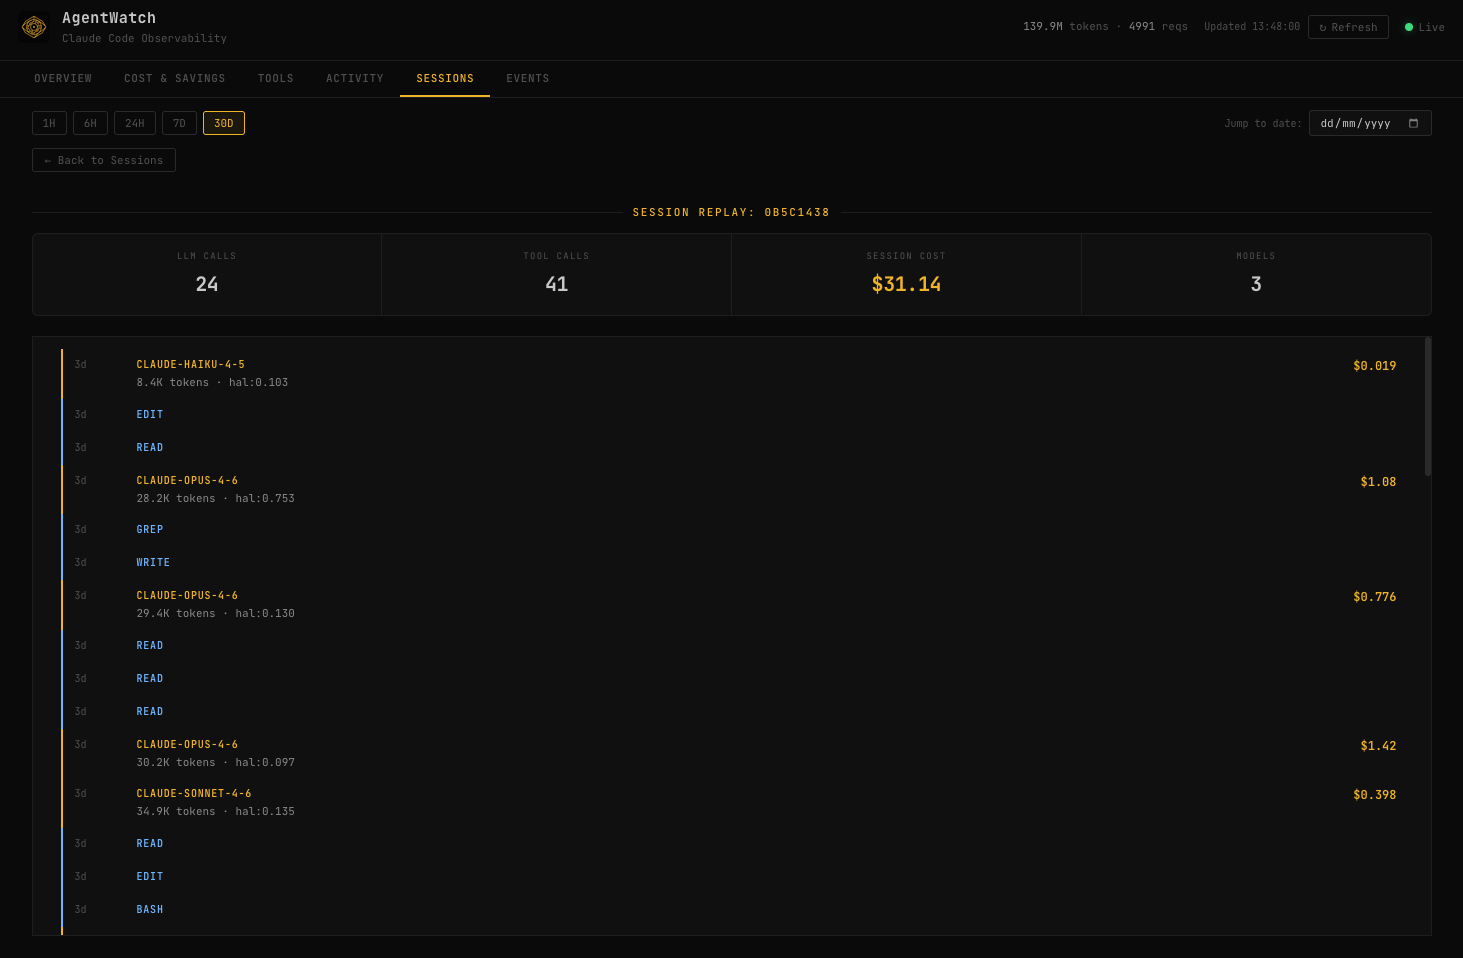
Open-source observability for Claude Code. Track costs, tokens, tools, and sessions — all running locally on your machine.
What would this cost at API rates?
Which projects eat the most tokens?
What does your AI agent actually do all day?
Real numbers from a Claude Max power user. Your numbers could be even higher.
See your API cost equivalent, monthly projections, and prompt cache hit rates.
Hour-of-day heatmaps, day-of-week trends, and what your AI actually does.
Click any session to replay it turn by turn — every LLM call, tool use, and cost.
One click to copy your stats as an image. Paste it anywhere.
Open the dashboard and discover what your Claude usage is really worth.